Meeting Data Pipeline Observability and Quality Monitoring
Preventing silent data failures before they corrupt downstream models and dashboards.
A column gets renamed upstream. A key field's distribution quietly shifts. Neither event trips a pipeline error, and nobody gets paged, yet dashboards start showing wrong numbers and a machine learning model spends days training on corrupted inputs before a single person notices. Not a crash, not a missing file, but data that looks fine on the surface while being wrong underneath: that is the actual shape of the problem this piece is about. The word "silent" carries the whole argument. Systems built to catch errors are, by design, blind to failures that never register as errors in the first place.
Scale makes this worse every year. The financial exposure is not a hypothetical risk analysts wave around to justify budget. Per IBM's report, over a quarter of organizations estimate they lose more than $5 million a year to poor data quality, and a smaller but meaningful share report losses many times that figure. Gartner's own research puts the average organizational cost at $12.9 million annually. Those numbers describe outcomes, not causes, but they establish the stakes.
The operational drag is arguably the more damning statistic. Once prevention has already failed, teams end up spending 50 to 60% of their working time hunting down inconsistencies, errors, and gaps in data they should have been able to trust, an operational drag that is arguably more damning. That's time spent doing forensic work rather than building anything. It's time spent doing forensic work on a system that should have told them what broke, when, and where. The gap between what teams need to know and what their tooling actually tells them is widening precisely because the volume and complexity of pipelines are growing faster than the visibility into them.
Data observability's meaning and its difference from monitoring and quality checks
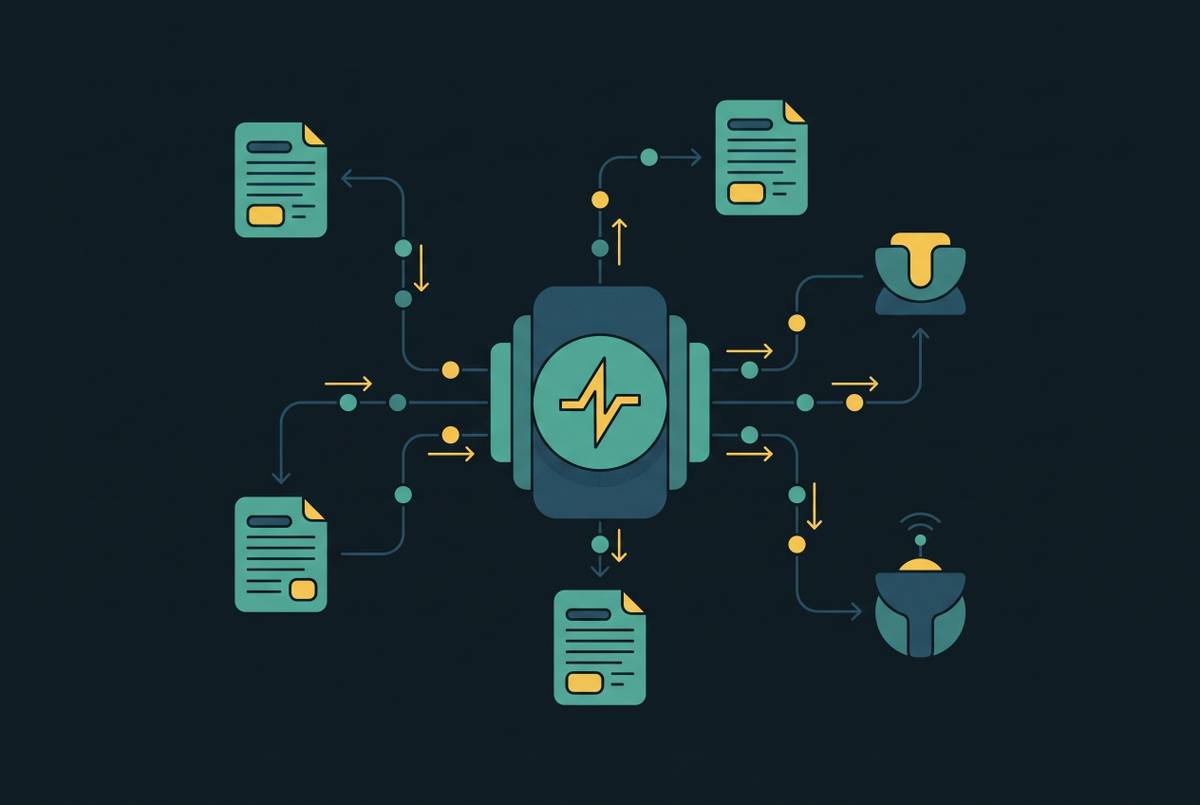
Data observability is the continuous monitoring, analysis, and understanding of data health, quality, and reliability across pipelines, platforms, and downstream applications. The operative word is continuous. Gartner frames it precisely: data observability tools let organizations understand the state and health of their data, pipelines, landscapes, and infrastructure, along with the associated financial costs, across distributed environments, by continuously monitoring, detecting, alerting, analyzing, and troubleshooting data workflows. That framing names five distinct verbs, not one. Monitoring alone is not observability; it's one ingredient.
Traditional monitoring tools work from static rules, scheduled checks, and predefined thresholds. They find what they were built to find, nothing more. Data observability instead establishes a baseline for what normal looks like and then flags departures from it, including anomalies that no engineer thought to write a rule for. Quality checks, including the dbt tests many teams already run, occupy a different lane still: they enforce predefined rules at fixed validation checkpoints, confirming that a field matches a pattern or a value falls within an expected range. Observability catches the unknown unknowns through machine-learning-driven anomaly detection on distribution and volume; quality tools catch the known unknowns through rules someone wrote down in advance. Neither replaces the other.
Software or application monitoring is a third category again, and it's easy to confuse with data observability because both produce dashboards full of green checkmarks. Software monitoring tracks whether an application is up, using logs, metrics, and traces. It answers "did the job run." Data observability answers a different question entirely: is the data coming out of that job correct, complete, and arriving on time. An Airflow job can report success while producing output that is materially wrong, and software monitoring will have nothing to say about it. Software observability confirms the job ran; data observability tells you the output looks different from yesterday; data quality tools confirm whether the values inside it comply with business rules. Quality tools enforce predefined rules at validation checkpoints, while observability catches unknown unknowns through ML-driven anomaly detection on distribution and volume, the two complementing rather than replacing each other.
The five pillars of data observability
The industry has largely converged on five pillars as the baseline for what comprehensive data observability actually covers: freshness, volume, schema, distribution, and lineage. Monte Carlo defined the framework in 2020, and it has held up well enough that most vendors and practitioners now treat it as the standard vocabulary for the discipline.
Freshness tracks whether data arrives on schedule, measuring how recently a dataset was updated relative to its expected cadence. The failure it catches is the pipeline that silently falls behind, leaving analysts working off numbers that are hours or days old without any indication that anything has changed. Picture a pipeline expected to run hourly that fails quietly: analysts keep pulling from stale tables, and no alert fires because the job never technically errored out. In an AI context, this failure mode gets more dangerous, not less: a freshness violation means an agent retrieves stale context and generates confident, fluent output based on conditions that no longer exist, and that can go undetected for days or weeks.
Volume tracks whether the amount of data arriving matches expected ranges, measured in record counts, file sizes, or batch completeness. It catches duplicate loads, missing batches, and the sudden drops or spikes that usually signal something has broken at ingestion. Volume anomalies tend to be the earliest visible signal that something upstream has gone wrong, so catching them early prevents the damage from compounding. Consider a daily transaction table that drops from hundreds of thousands of rows to a few thousand overnight: without volume monitoring in place, the first person to notice is often the CFO, staring at a revenue dashboard that has quietly stopped telling the truth.
Schema tracks structural changes: added, renamed, or removed columns, type changes, changes to nullable flags. It catches upstream API or source system changes that break downstream pipelines without producing an obvious error. Schema drift is insidious precisely because pipelines don't fail immediately when it happens; they keep running, silently processing the wrong column or coercing an incompatible type, until the distortion finally appears in a report someone actually reads.
Distribution tracks statistical patterns inside the data itself: null rates, value ranges, cardinality, outliers, and shifts in how values spread across a field. This is the pillar built to catch degradation that leaves no structural fingerprint at all. Pipelines run cleanly, schemas stay intact, and yet the values have drifted. Catching that requires machine-learning-driven baselines rather than hard-coded thresholds, because static rules can't adapt to seasonal patterns or ordinary variation; distribution monitoring instead learns what normal looks like for each individual table and flags departures from that learned baseline. It is, by a fair margin, the hardest pillar to cover with static rules, because the failure it prevents is structurally indistinguishable from correct data.
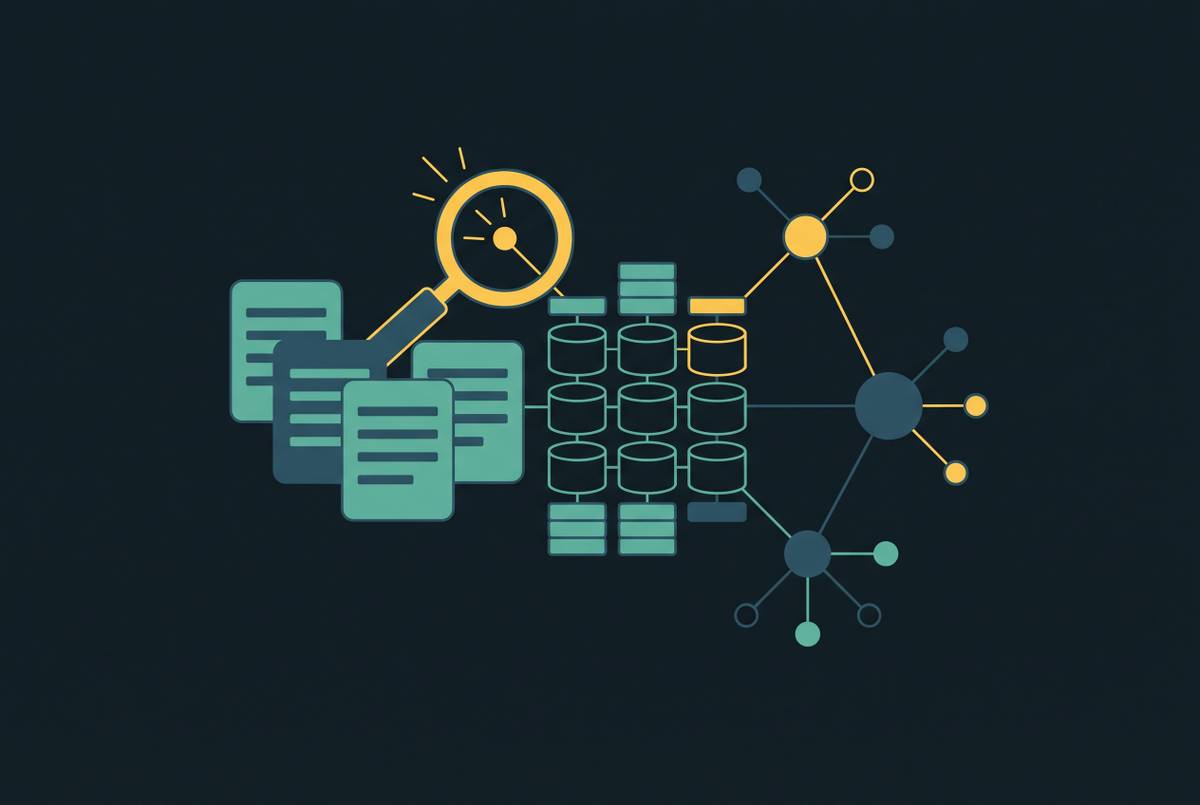
Lineage tracks the end-to-end flow of data, from source systems through every transformation to its final consumption in a dashboard, model, or downstream application. It catches the inability to trace where a problem started or which downstream assets it touched, turning a five-minute fix into a multi-hour investigation. Column-level lineage is where tools genuinely diverge from one another: table-level lineage shows the pipeline graph, but column-level tracing follows one specific field through every transformation to every downstream consumer, and that depth is what makes root cause analysis fast rather than exploratory.
How the five pillars interact: why a gap in any one creates blind spots across the others
None of the five pillars work in isolation. They're interlocking signals, and a failure in one dimension nearly always appears as a symptom in another, provided someone knows where to look.
Freshness and volume are tightly coupled. A missed batch registers as both a freshness violation, because the data has gone stale, and a volume drop, because fewer records arrived than expected. Monitor only one of the two and the other becomes an invisible gap sitting right next to the one being watched.
Schema and distribution interact in a subtler way. A type change or a quiet column rename may not break the pipeline outright, but it will corrupt the distribution of every downstream field that depends on it. Distribution monitoring is what catches the damage that schema monitoring misses once the structural change has already slipped through undetected.
Lineage is the connective tissue that ties the other four together. Without it, a team that detects a distribution anomaly has no fast way to determine whether the problem originated at ingestion, inside a transformation step, or in a join somewhere in the middle. Lineage is what converts a vague "something is wrong" into "here is exactly where it started, and here is everything downstream it touched."
The practical consequence is unforgiving. Monitoring only two or three of the five pillars leaves specific, predictable blind spots. A tool that covers fewer pillars isn't partially safe; it's unsafe in precisely the ways its uncovered pillars describe. That is also where unknown failure modes that no one anticipated go undetected. Static rules only catch what engineers thought to anticipate, while machine-learning-driven baselines running across all five pillars catch the failure modes that have never happened before, the ones nobody wrote a rule for because nobody knew to expect them.
Where data quality monitoring fits alongside observability
Observability and quality monitoring answer two different questions. Observability detects anomalies using machine-learning-driven baselines: it tells you that something unexpected happened. Quality monitoring enforces predefined business rules at specific checkpoints: it tells you whether data meets a standard someone already defined.
Quality monitoring contributes things observability doesn't cover on its own. Rule-based validation checks that specific fields conform to expected formats, ranges, or referential integrity constraints, business logic that can't be inferred just by watching historical patterns. Completeness enforcement makes sure all expected data has actually arrived and meets a defined threshold before downstream processes are allowed to start, functioning as a blocking check rather than a retrospective alert. Semantic correctness goes a step further still, verifying that a value isn't just statistically plausible but actually means what it's supposed to mean: a field can read as a perfectly valid date and still represent the wrong event entirely.
A pipeline that halts on a failed check keeps bad data from reaching downstream consumers. Embedding quality checks directly into pipeline logic means that when a critical check fails, say a null rate crosses a threshold or a referential key goes missing, the pipeline halts and keeps the bad data from moving downstream at all, rather than simply alerting someone after the damage has already spread.
Observability, in turn, covers what quality rules structurally cannot. Quality rules only catch what an engineer anticipated in advance; observability's machine-learning-driven baselines catch the distribution shifts and volume anomalies nobody wrote a rule for, because nobody knew to expect them. Together the two close the loop that neither closes alone: software observability confirms the job ran, data observability flags that the output looks different from yesterday, and data quality tools confirm whether the field values inside it actually comply with business rules. Quality tools enforce predefined rules at validation checkpoints while observability catches unknown unknowns through ML-driven anomaly detection on distribution and volume, the two complementing rather than replacing each other. Both are far more valuable as continuous, automated processes than as point-in-time checks run once and forgotten, and that continuity is what separates proactive reliability engineering from a team perpetually fighting fires it should have seen coming.
How AI workloads extend the requirements beyond the five structural pillars
The five structural pillars catch data that is wrong, stale, or broken. The structural pillars catch when data is wrong, stale, or broken, but AI pipelines introduce a failure mode they don't fully cover on their own: semantic drift, where the meaning of the data has quietly shifted even though nothing structural has changed at all. A field's values can look statistically normal, the schema can stay perfectly intact, and the pipeline can run precisely on schedule, and yet the real-world meaning behind that data has moved, leaving any model or agent reasoning over it working from false premises without any structural signal to warn it.
The risk compounds sharply in agentic systems. A freshness violation in an AI context doesn't just mean stale numbers on a dashboard; it means an agent retrieves outdated context and generates confident, authoritative-sounding output based on conditions that no longer hold, and a team may not catch this until the model has been making wrong decisions in production for days or weeks. It's an autonomous system acting on bad premises at machine speed.
Data and AI observability extends the framework to cover AI-specific concerns: model input drift, RAG retrieval quality, agent execution traces, and output consistency, instrumentation that has no analog in traditional pipeline monitoring. AI spending is forecast to keep growing at a rapid year-over-year pace, per Gartner, and as that investment scales, the cost of poor data quality scales right alongside it, narrowing the margin for error considerably. Gartner has been direct about the consequence: it predicts organizations will abandon 60% of AI projects unsupported by AI-ready data through 2026. Observability and quality monitoring, taken together, are the infrastructure that actually makes data AI-ready.
The confidence gap inside organizations bears this out. Per IBM's CDO Study, only a small fraction of chief data officers say they're confident their data can support new AI-enabled revenue streams, even though most report that their data strategy is already integrated with their technology roadmap. Strategy and execution have drifted apart, and that gap, at bottom, is a data reliability gap.
Regulatory requirements that make observability non-optional for governed data environments
Regulations including GDPR, HIPAA, CCPA, SOX, and the EU AI Act require organizations to keep data accurate, complete, and consistent, and in most cases to demonstrate that they can actually prove it. That last clause is the one that turns observability from a nice-to-have into a compliance necessity. Proving data integrity after the fact, with no automated trail, is a fundamentally different and far more expensive task than proving it continuously as a byproduct of how the pipeline runs.
Lineage is the pillar doing most of the compliance work here. End-to-end lineage gives regulators the audit trail showing where data originated, how it was transformed at each step, and who accessed it along the way. Without automated lineage tracking, that documentation has to be reconstructed by hand after something has already gone wrong, a process that is both unreliable and expensive, and rarely convincing to an auditor asking pointed questions.
The EU AI Act adds a new and more specific driver. Its requirements around AI system transparency and data governance create a direct compliance dependency on the AI observability capabilities described above: semantic integrity and agent execution traces stop being purely engineering instrumentation and become audit artifacts that regulators can request. Data breach exposure raises the stakes further still. IBM's Cost of a Data Breach Report puts the average U.S. breach cost at a record high, and poorly governed data raises both the probability that a breach occurs and the severity of the damage once it does. Market analysis from Mordor Intelligence frames the broader trend well: growth in this space reflects a decisive shift from reactive monitoring toward proactive data reliability engineering, a shift accelerated by both AI workloads and compliance mandates like the EU AI Act arriving at roughly the same time.
What a continuous automated monitoring architecture looks like in practice
None of this works as a quarterly audit or a checklist run before a board meeting. The five pillars, quality monitoring, and the AI-specific extensions all depend on running continuously, in the background, watching every pipeline at every stage rather than sampling a handful of tables once a week.
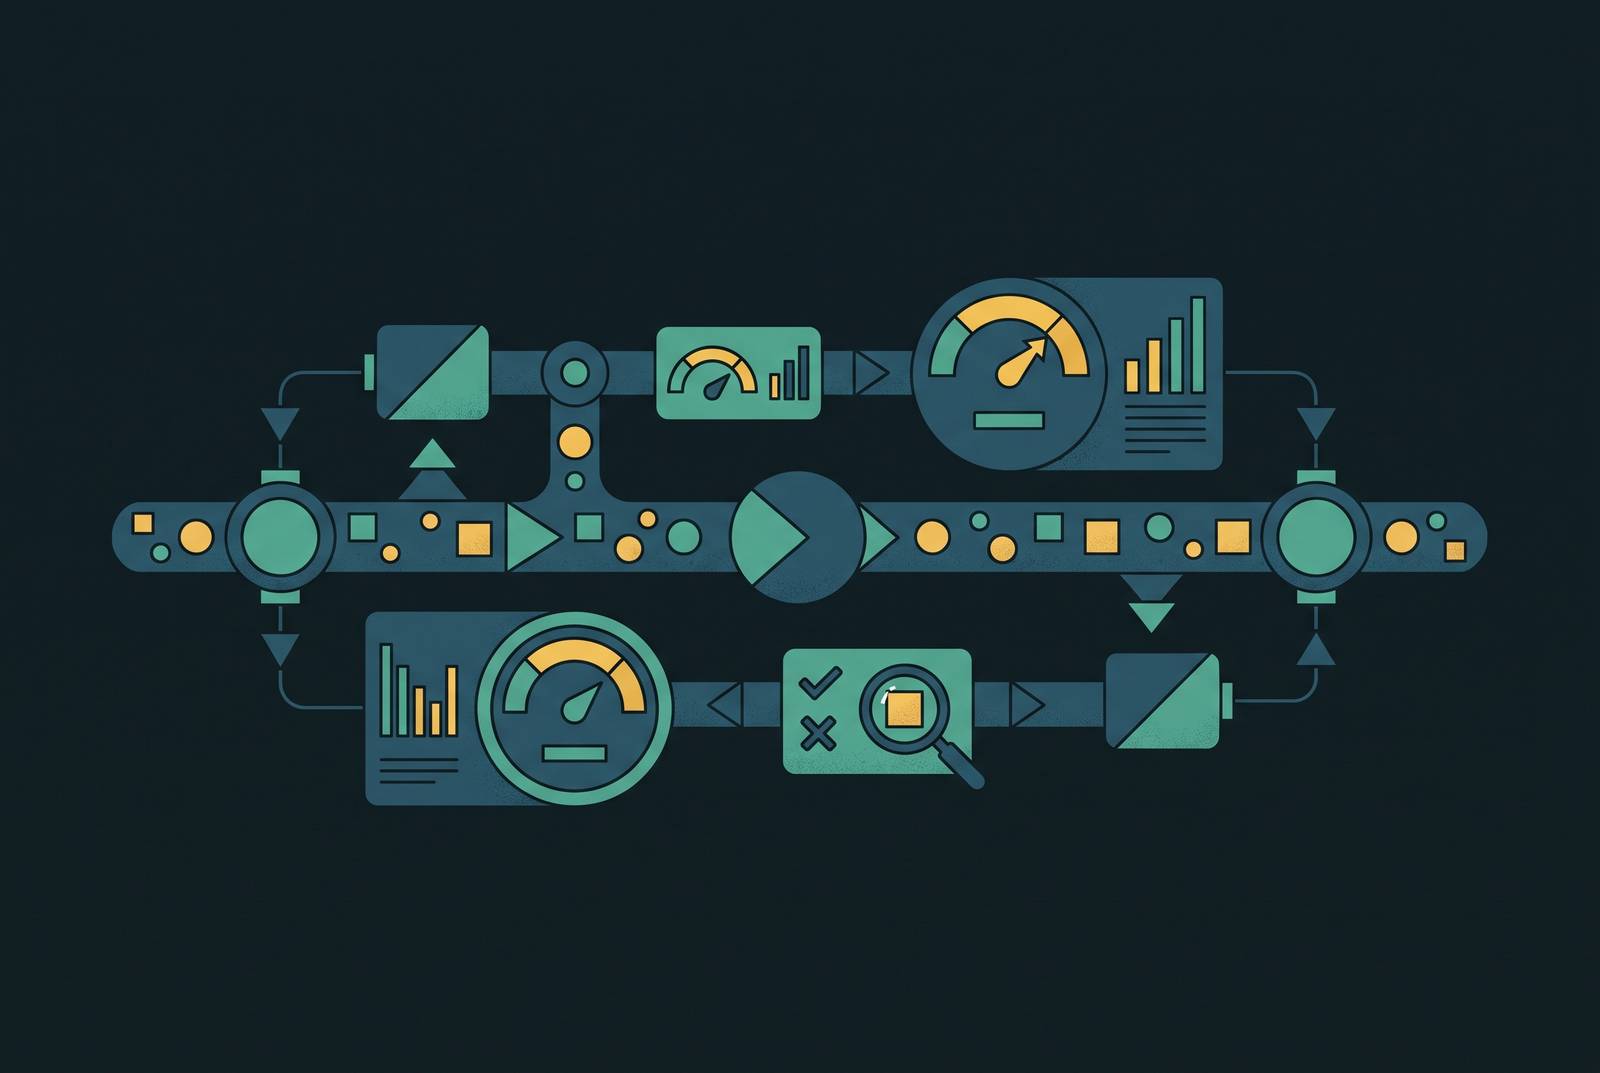
In practice, that means machine-learning-driven baselines sit across freshness, volume, schema, and distribution simultaneously, learning what normal looks like for each individual table and field rather than applying one static threshold to everything. Lineage, ideally at the column level, runs alongside those baselines so that when an anomaly fires, the system can already show where it originated and what else downstream is affected, rather than leaving an engineer to trace it backward by hand. Quality rules sit inside the pipeline itself as blocking checks, not as a separate audit step run after data has already reached a dashboard. A null rate breach or a broken referential key stops the pipeline before bad data ever reaches a consumer.
Layered on top of that, for organizations running AI workloads, sits the newer instrumentation: monitoring for model input drift, tracking retrieval quality inside RAG systems, logging agent execution traces, and checking output consistency over time. None of that replaces the five structural pillars. An agent making decisions off data that is technically fresh, complete, and correctly typed can still be reasoning from a meaning that has quietly shifted underneath it, extending the same failure. Continuous, automated, and layered: that's the architecture. Anything less reintroduces the exact gap this piece opened with, a pipeline that reports success while quietly getting everything wrong.
Sources
- What Is Data Observability? 5 Key Pillars To Know In 2026
- Data Quality vs Data Observability: Key Differences | Conduktor
- Data Observability vs Monitoring: What's the Difference?
- Data Pipeline Observability: What It Is and Why It Matters | Airbyte
- Data Observability for AI Pipelines: The Sixth Pillar [2026]
- Observability for AI Workloads: A New Paradigm for a New Era | by Dotan Horovits (@horovits) | Medium