Recording Bot Reliability and Failure Recovery Patterns
Silent degradation in recording bots costs more than downtime ever could.

Recording bots fail in predictable places, and most of those failures share one trait that separates them from ordinary software bugs: there's no replay button. A dropped API request can be retried. A live meeting that a bot fails to capture is gone the moment it ends, and the gap between "the bot ran" and "the recording is usable" is where entire categories of client work quietly disappear.
Most engineering teams build for uptime. Recording infrastructure needs a different mental model, because the cost of failure isn't downtime, it's data that never existed in the first place. Compound AI reliability research covering 150 production incidents found that 51% involved silent degradation: the system stayed up, kept running, and produced wrong output anyway. Those incidents took an average of 4.2 days to detect, against roughly 12 minutes for a hard crash. Translate that to a recording bot and the analog writes itself: a bot finishes its job, reports success, and hands back a transcript with misattributed speakers or a corrupted audio track. Nobody catches it until a human actually reads the thing, and by then the meeting is over with no second take available.
The bot's lifecycle, authenticate, join, wait, capture, process, deliver, gives a map of where these failures live. Each stage looks fine in a demo. Production is where the cracks show, and the teams that treat every stage as equally fragile end up building the wrong defenses in the wrong places.
How the bot state machine exposes every failure surface
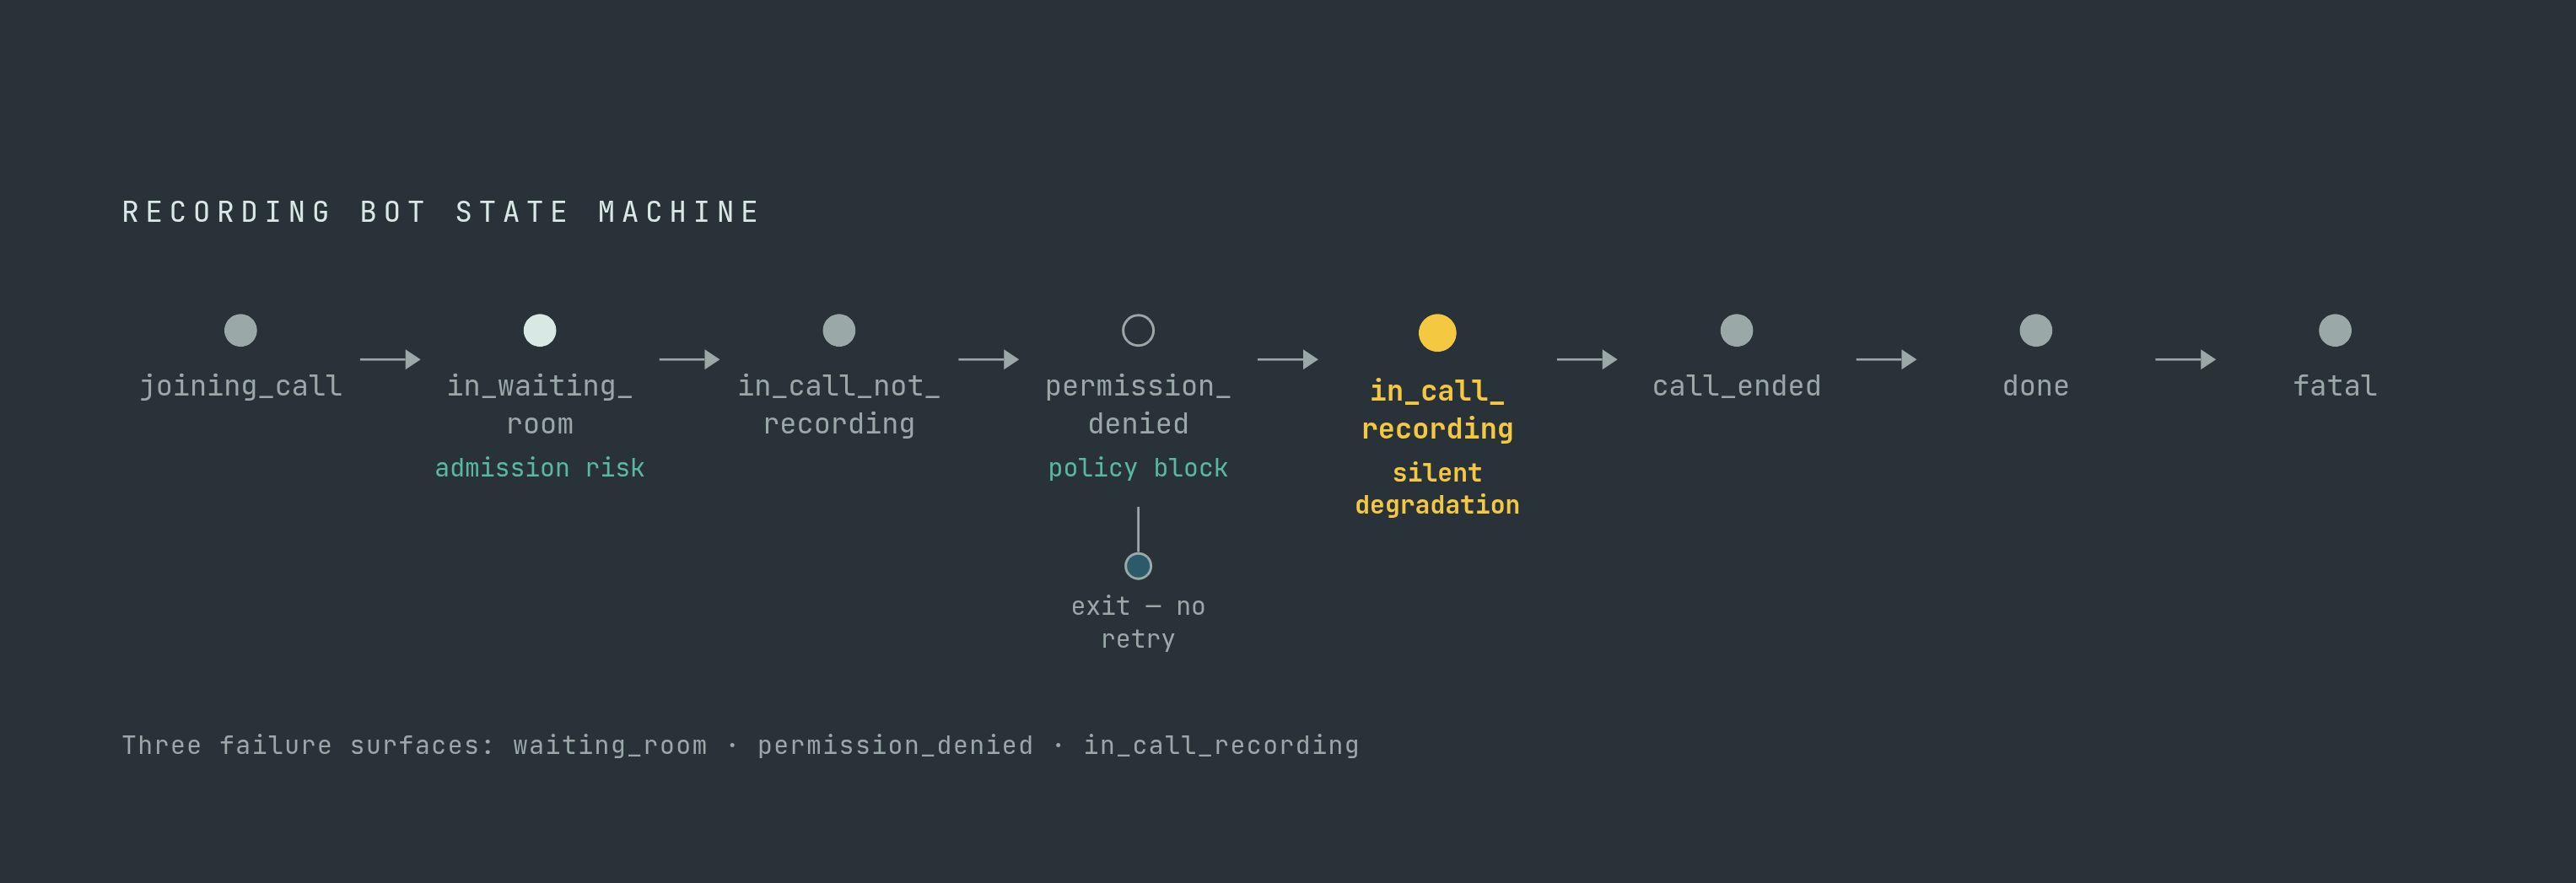
Recall.ai's webhook event system, used by more than 2,000 companies building on its API, is the clearest public example of what a bot's internal state actually looks like once you expose it. Instead of one "success or failure" flag, the bot reports named states that map directly to where things go wrong: bot.joining_call for the joining process in progress, bot.in_waiting_room for a bot let into the platform but not yet the meeting, bot.in_call_not_recording for the gap between showing up and actually capturing anything, bot.recording_permission_denied for a hard policy block, bot.in_call_recording for the nominal running state, bot.call_ended, bot.done, and bot.fatal for the unrecoverable crash.
Each name does double duty. It marks progress through the lifecycle, and it marks a distinct failure surface, since a bot can get stuck at any one of them. That distinction is the whole point: a bot stuck in bot.in_waiting_room calls for a different response than one that receives bot.recording_permission_denied, and a monitoring system that can't tell those two apart ends up treating every failure the same way. Usually that means doing nothing until a client complains. Granularity here isn't a nice-to-have. It's the difference between routing a failure to the right recovery path and finding out about it secondhand, from someone outside the engineering team.
The three stages where failures concentrate: authentication, admission, and capture
Three stages account for most of what breaks before a recording even has a chance to exist, and treating them as one undifferentiated "bot didn't work" bucket is the mistake most monitoring setups make.
Authentication failures happen quietly. A credential expires, an OAuth token rotates, an API key gets revoked, and the bot never reaches the meeting at all. If nothing is watching for the absence of a bot.joining_call event, this failure produces no signal whatsoever. The meeting happens, no bot shows up, and nobody notices until someone asks where the recording is.
Admission failures sit one step further in. The bot reaches the platform but the host never lets it into the actual meeting, so it stalls in bot.in_waiting_room indefinitely. ScreenApp's open-source meeting bot (screenappai/meeting-bot) handles this with automatic retry on admission timeouts, but the timeout threshold itself is a real design decision, not a default to leave alone. Set it too short and the system flags healthy bots as failed. Set it too long and genuine failures sit unnoticed while capacity gets tied up waiting.
Permission denial is a different animal, and it's the one most retry logic gets wrong by treating it like the other two. bot.recording_permission_denied isn't a glitch, it's a policy decision made by a host or an IT admin, and no amount of retrying changes that outcome. It needs its own response path: notify someone, fall back to another capture method, or escalate to the account owner. Agency settings make this worse, because the bot shows up in the meeting as a visible outside participant. That's a trust problem sitting on top of a reliability problem, and hosts who don't recognize the bot are the ones most likely to block it.
Then there's the failure mode that looks fine from the outside, and it's the one worth worrying about most. A bot sitting in bot.in_call_recording can still be capturing corrupted or incomplete audio, or mislabeling who's speaking, while every status check says everything is normal. Compound AI system research on retrieval failures found a 2.3x multiplier on downstream errors once a bad input enters the pipeline. A degraded capture at this stage doesn't produce one bad artifact. It compounds through every stage that follows.
What breaks in the process and deliver stages, and why it's harder to detect
Transcription, speaker diarization, and summarization all run after the call has ended, which means their errors stay invisible until someone opens the output and reads it. A bot hitting bot.done tells you the lifecycle finished. It says nothing about whether the transcript is any good, and conflating those two things is exactly how a corrupted transcript ships to a client with a green checkmark next to it.
Type coercion between pipeline components is the risk most teams underestimate. Compound AI system research documented floating-point precision shifts during handoffs between two different programming-language components that silently dropped 23% of results. No error thrown, no alert fired, just missing data nobody asked about.
Delivery failures split into two categories with very different risk profiles. Upload failures are recoverable as long as retry logic exists, and ScreenApp's bot handles this well: it retries failed uploads automatically and only deletes local recording files after a confirmed successful upload. Webhook delivery is less forgiving. Recall.ai documents a hard ceiling: 60 retry attempts per event, spaced one second apart. Once those 60 attempts run out, the endpoint gets marked failed and no further messages go out, with no manual retry available. A consumer-side outage lasting more than a minute, if it isn't caught and acknowledged in time, loses the event permanently.
This is exactly where that 4.2-day detection lag shows up in practice. Process and deliver failures surface after the call has ended, and if nobody reviews the output right away, the gap between the failure and its discovery stretches for days. Output quality gates are the direct countermeasure, not an optional add-on, and the same compound AI research found that gates like these caught 73% of silent degradation incidents before they reached a user. Waiting for a client to notice first is not a monitoring strategy.
How retry logic becomes the failure it was designed to prevent
Retry is the default reflex for almost every failure mode covered so far, and that reflex is the problem. Under load, unthrottled retry turns into its own failure category, and it's arguably worse than the failure it was meant to solve, because it fails the entire system instead of one bot.
The mechanism is called a retry storm, and it plays out the same way across most systems: something fails, retry logic kicks in automatically, and if enough dependent systems try to reconnect at once, the resulting traffic overwhelms the very infrastructure that's trying to recover. Cloudflare's well-documented infrastructure incident shows how fast this cascades: a feature file inside its Bot Management system exceeded a hard-coded memory allocation ceiling, the system panicked instead of degrading gracefully, and a single configuration limit turned into a widespread outage. Missing kill switches make this worse. A bad configuration change can spread faster than any team can step in and stop it.
Webhook consumers create a subtler version of the same problem. Picture an endpoint that accepts a webhook request, starts processing it synchronously, hits a slow database query or a sluggish downstream API call, and takes 25 seconds to return a 200 OK. The sender logs that as a success. Meanwhile the consumer's own internal queue backs up, and every retry that arrives in the meantime lands on an endpoint that's already struggling. Smarter retry logic doesn't fix this; the fix is architectural. Accept the request fast, hand processing off to something else, keep the handler close to stateless, and back it with a durable, bounded queue and workers whose concurrency is capped.
Recall.ai's 60-attempt, one-second-interval cap works as its own guard against runaway retry storms, but it trades one risk for another: it gives a consumer a narrow, fixed window to recover before the event is gone for good. Compound AI research extends the classic SRE circuit breaker into something more useful here: semantic circuit breakers that trip not just on 500 errors but on semantic signals, like a transcript quality score dropping below a set threshold. In that research, circuit breakers cut how deep an error cascade traveled through the system by 89%.
Building recovery infrastructure that survives the failure it's designed to handle
A dead-letter queue is the non-negotiable piece, and any pipeline without one is choosing to lose data on purpose. Once retries run out, failed events need somewhere to land besides the void. A DLQ captures them for investigation and manual recovery instead of dropping them silently. Categorizing by failure type matters here: a hundred 401 errors from the same customer points to a rotated API key, not a network blip, and treating those two causes the same way wastes time chasing the wrong fix. DLQ size and growth rate deserve their own alert thresholds, since a sudden spike is the clearest early signal that something systemic is breaking, not isolated noise from one flaky connection.
Graceful shutdown matters more than it sounds. ScreenApp's bot builds in proper cleanup and resource management on shutdown, which stops partial writes and orphaned processes from corrupting whatever comes next in the pipeline. The sequencing rule is simple and easy to get backwards: delete local files only after the upload is confirmed successful, never before.
Typed interfaces at the boundaries between pipeline stages close off a whole category of failure. Compound AI system experiments using strict, Pydantic-style contracts at component handoffs eliminated 92% of integration failures. Applied to a recording pipeline, that means enforcing schema contracts between the capture stage, the transcription service, and the delivery webhook, so a malformed payload gets caught at the boundary instead of silently corrupting the next stage.
Isolating components also limits how far a single failure spreads. The same research found that isolating components cut the share of concurrent requests affected by one failure by 64%. For a recording bot, that means running capture, processing, and delivery as separate workers, so a transcription service outage doesn't take the audio store down with it.
None of these patterns work well in isolation. Systems that combined three or more resilience patterns cut mean time to recovery by 71%, from roughly 29 minutes down to about 8, according to the same 150-incident corpus. At the webhook boundary itself, signing the request body with HMAC-SHA256 (ScreenApp's bot does this via an X-Webhook-Signature header) matters more than it looks in any single-client deployment, because in a multi-client setup a compromised consumer could otherwise corrupt events across accounts that have nothing to do with each other.
When bot-free recording is the more reliable architecture
None of the recovery infrastructure above touches one failure mode: a host who simply blocks the bot. No retry logic and no dead-letter queue fixes bot.recording_permission_denied. Once that fires, the session is lost, full stop, and this is where most teams get the architecture backwards, defaulting to bot-based capture for every use case when the failure mode itself argues against it.
Bot-free recording sidesteps the problem by capturing audio directly from the user's own device, with no external participant in the meeting for a host or platform policy to block. The trust issue and the reliability issue are technically separate, but they reinforce each other in practice: a visible bot sitting in a client call can make a host uneasy enough to remove it, producing exactly the permission failure that bot-free capture never risked in the first place.
Two concrete options show the shape of this category. Fireflies' Desktop App, launched in November 2025, runs on Mac and Windows and captures audio on-device across a range of platforms and even in-person conversations picked up through a laptop's microphone. Meetily Community Edition takes a different angle: free and open source under the MIT license, with local bot-free recording, local transcription, and AI summaries built in, alongside a a paid Pro tier.
The trade-off is real, not cosmetic, and it should decide the choice rather than get glossed over. Bot-free capture solves the admission and permission problem outright, but it gives up the meeting metadata and speaker-labeling infrastructure a bot API provides natively. For agencies running client-facing calls, where the visible bot itself is the thing generating the permission denials in the first place, bot-free capture is the better default, not a fallback. Bot-based infrastructure still earns its place for internal team recordings run at scale, where nobody is deciding whether to let a stranger into the room.
Monitoring the failure modes you cannot prevent
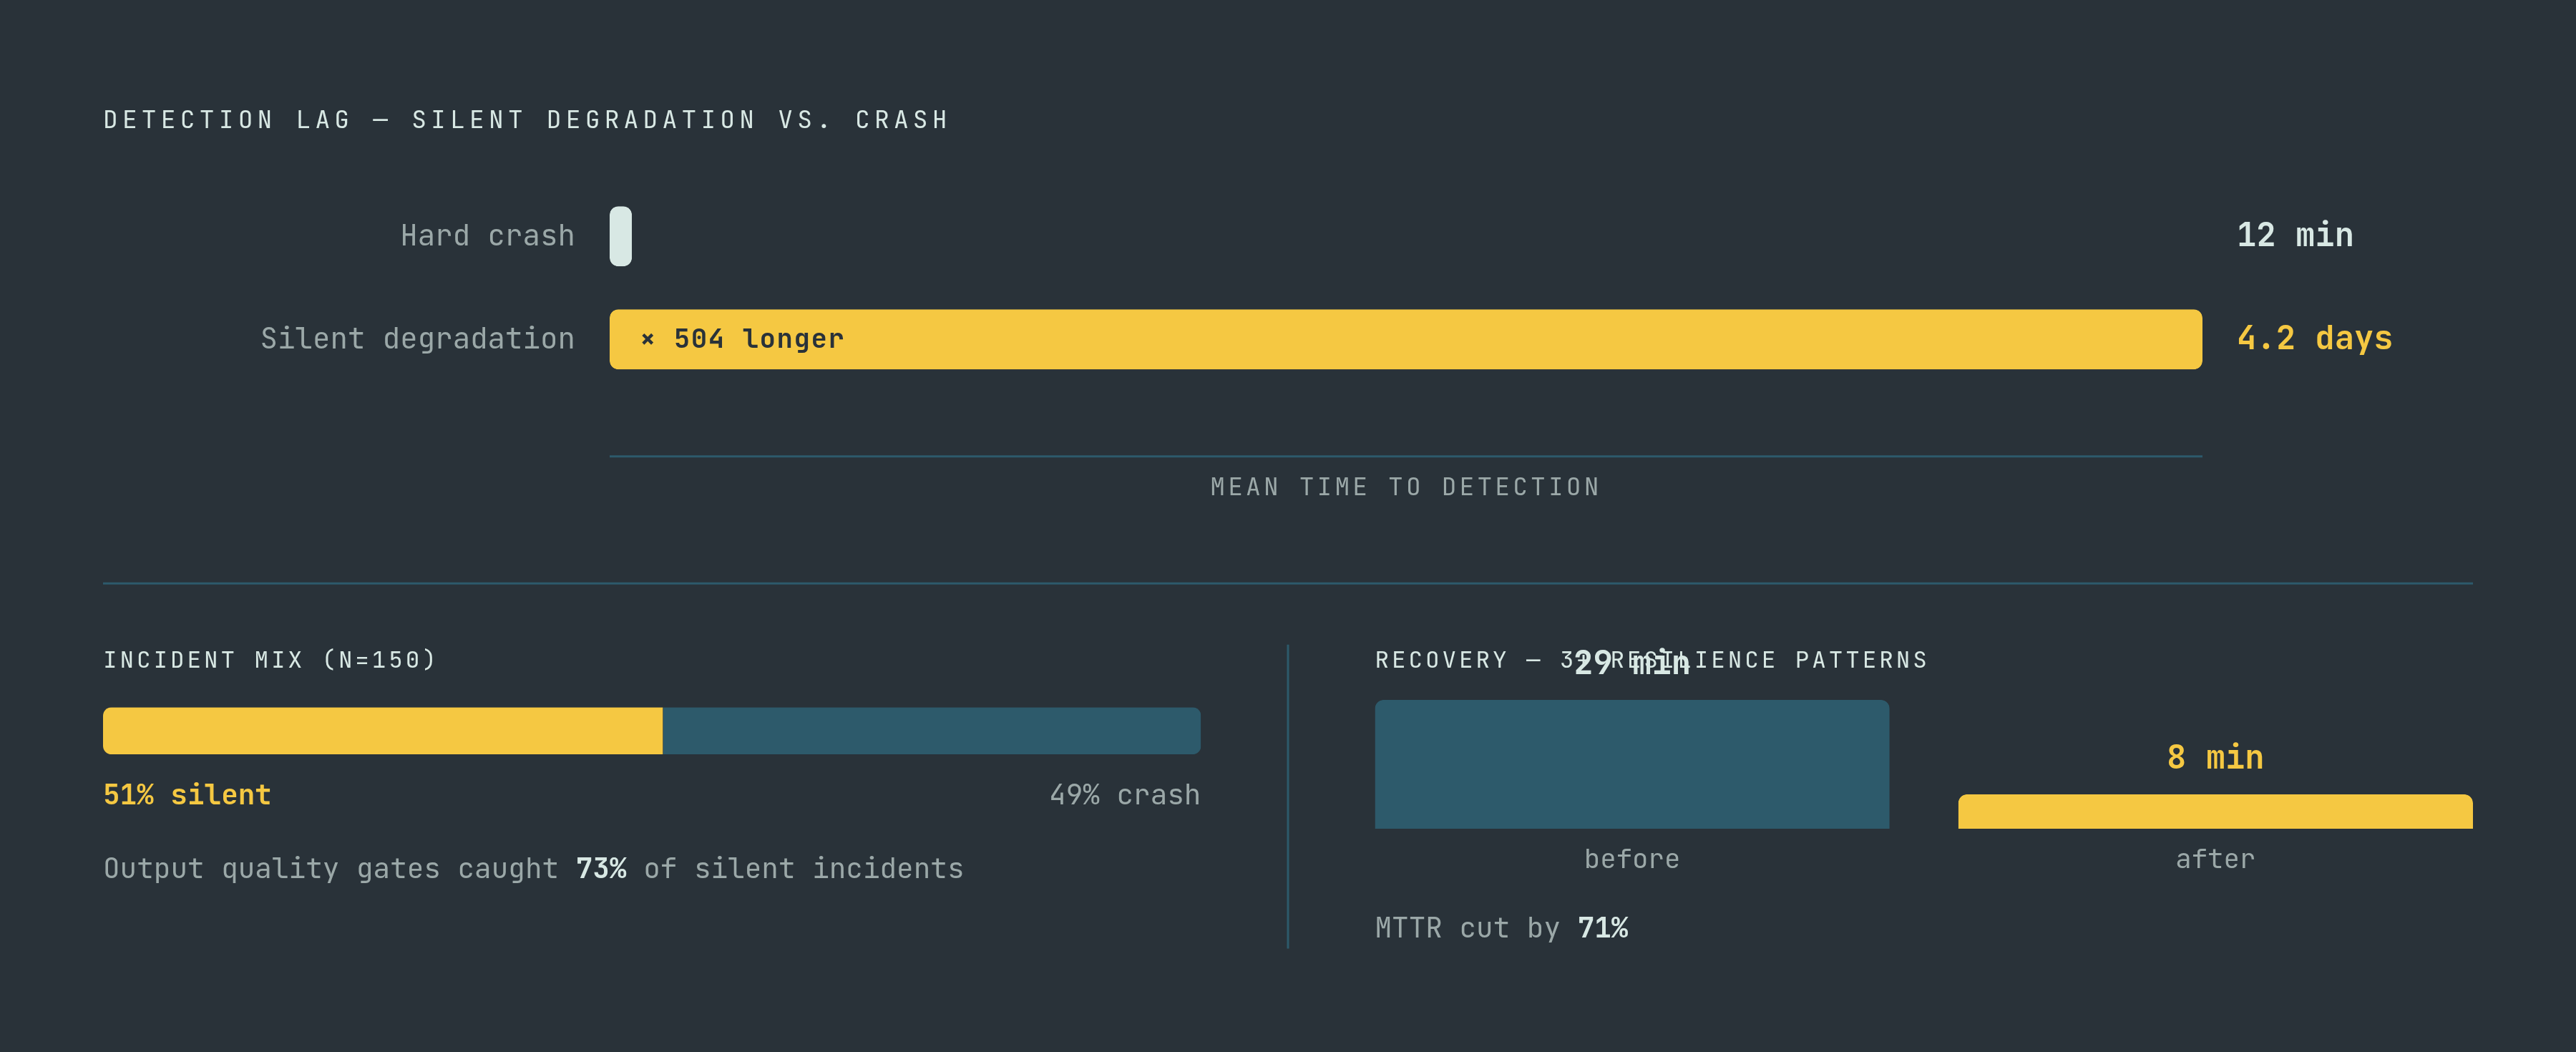
That 51% silent degradation figure changes what monitoring is for. Most of what breaks in this pipeline isn't a crash that trips an alert. It's a quality drop that only shows up if something is watching for it at a semantic level, not just checking whether the process is still running, and a monitoring stack built only for uptime will miss almost all of it.
Prometheus metrics, as implemented in ScreenApp's open-source bot, cover the baseline: join latency, recording duration, upload success and failure rates, and retry counts broken out by stage. That's the foundation, not the ceiling.
OpenTelemetry adds a layer on top of that baseline. The OpenTelemetry GenAI SIG has been building semantic conventions for AI workloads since 2024, though as of mid-2026 they remain experimental. Those conventions define span names like invoke_agent, chat, and execute_tool for general AI workloads, not bot lifecycles specifically, but the underlying pattern still fits: a parent span for the overall session, with child spans named for each lifecycle stage (bot.join, bot.capture, bot.process, bot.deliver). Structured that way, a team can query for every session where capture ran longer than expected, or every delivery stage that retried more than a set number of times, instead of digging through logs one incident at a time.
Output quality gates remain the strongest defense against silent degradation specifically, and skipping them to save a few hundred milliseconds of latency is a bad trade. Checking transcript completeness against the ratio of duration to word count, verifying speaker label coverage, and setting a floor on confidence scores before delivery, all of that runs before a transcript ever reaches a client. The compound AI research found gates like these catch 73% of silent degradation incidents before a user ever sees them.
DLQ monitoring ties back into all of this. Growth rate in the dead-letter queue is a leading indicator of a systemic failure in progress, not a one-off blip worth ignoring. The 4.2-day detection lag isn't an abstract statistic, either: it's the real cost of underinvesting in this layer. In a client-facing recording pipeline, that's days' worth of corrupted transcripts already delivered before anyone starts asking questions. Monitoring is where that cost either gets caught early or gets paid in full.